خانه هوشمند آیریک
آیریک، پیشگام در ارائهی راهکارهای هوشمندسازی و اینترنت اشیا، با محصولات دانشبنیان خود، زندگی را هوشمندتر و آینده را سبزتر میسازد.

خانه هوشمند آیریک
آیریک، پیشگام در ارائهی راهکارهای هوشمندسازی و اینترنت اشیا، با محصولات دانشبنیان خود، زندگی را هوشمندتر و آینده را سبزتر میسازد.
مأموریت هفنا
شرکت هوشکاوان فناوری نوین آیریک (هفنا)، فلسفهی وجودی خود را بر «ارائهی راهکارهای نوین و خلاقانه در جهت بهبود زندگی انسانها، با حفظ سلامت محیط زیست» استوار دانسته است. بر همین اساس، تلاش شده است این آرمان در تمامی فعالیتها، محصولات و خدمات شرکت نهادینه شود. امیدواریم بتوانیم راهحلهایی ارائه دهیم که به بهبود شرایط محیط شهری و زیستمحیطی کمک شایانی نماید. خانهی هوشمند آیریک، محصولی دانشبنیان از شرکت هوشکاوان فناوری نوین آیریک است که با چشمانداز ارائهی راهکارها و محصولات هوشمندسازی، در جهت ارتقاء سطح کیفی زندگی انسانها، پا به عرصهی رقابت با برندهای بینالمللی گذاشته است. هدف این برند، ارائهی محصولاتی با کیفیت و متناسب با استانداردهای تدوینشده میباشد. همچنین، پشتیبانی قوی و بومیسازی محصولات را جزو ارزشهای پیشنهادی خود میداند. زمینههای فعالیت شرکت شامل اینترنت اشیا (IoT)، هوشمندسازی و اتوماسیون ساختمانها و مراکز صنعتی است. تاکنون، محصولات این شرکت در بسیاری از ساختمانهای مسکونی و چندین مرکز صنعتی به بهرهبرداری رسیده و رضایت مشتریان را به همراه داشته است.
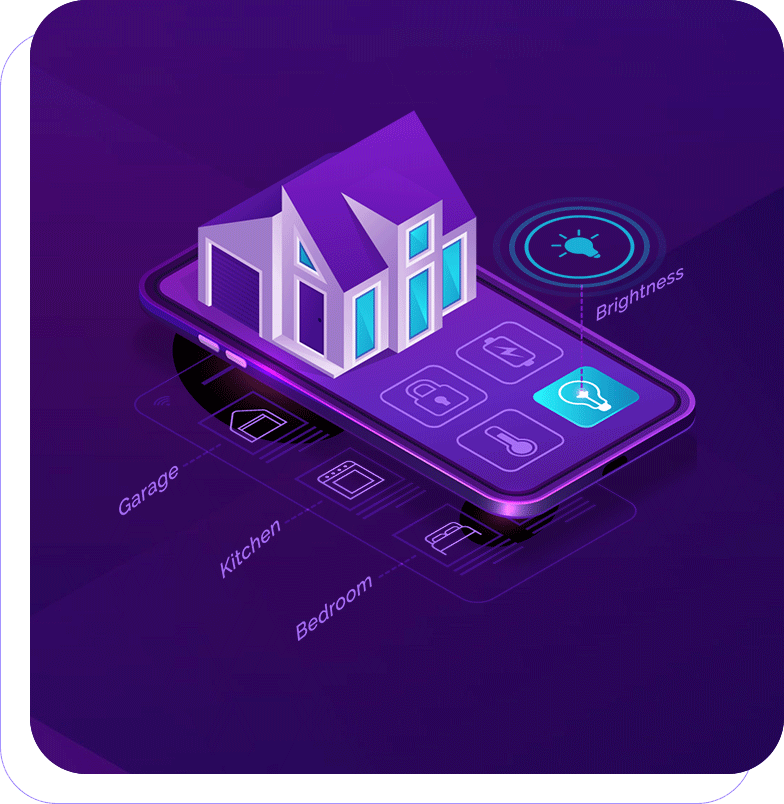
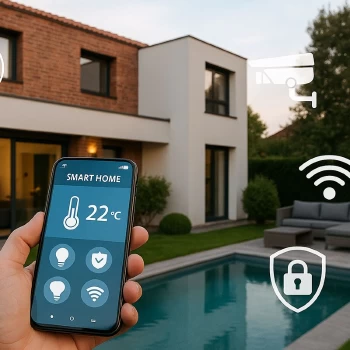
امکانات خانه هوشمند چیست؟
مزایا محصولات

اعتماد به محصول
10 سال خدمات پس از فروش و اعطای گارانتی 2 ساله برای مشتریان و مصرف کنندگان گرامی یکی از مزایای رقابتی محصولات بومی و تولیدات داخلی نسبت به محصولات خارجی است.

قیمت مقرون به صرفه
ما در خانه هوشمند آیریک به عنوان یک شرکت هوشمند سازی ساختمان، با پیشنهاد سبدی از محصولات متنوع در طرحهای مختلف و ارائه انواع قیمت هوشمند سازی ساختمان بیسیم سعی در راضی نگه داشتن مشتریان و مصرفکنندگان گرامی داریم.

قابلیت شخصیسازی
زیبایی، قابلیت سفارشی سازی و رابط کاربری آسان یکی از ویژگیهای بارز و دوست داشتنی محصولات آیریک است که دست مشتریان را در زیباتر کردن خانهشان باز میگذارد.
محصولات ما


سئوالات متداول
سیستم هوشمندسازی مجموعهای از فناوریهاست که امکان کنترل و مدیریت هوشمند تجهیزات ساختمان مثل روشنایی، گرمایش و سرمایش، پردهها، امنیت و انرژی را از طریق موبایل یا پنل مرکزی فراهم میکند. این سیستمها باعث افزایش رفاه، صرفهجویی در انرژی و ارتقاء امنیت میشوند.
بله، بسیاری از سیستمهای هوشمند، بهویژه مدلهای بیسیم (Wireless)، قابلیت نصب در ساختمانهای قدیمی بدون نیاز به تخریب و سیمکشی مجدد را دارند.
خیر، سیستمهای ما با رابط کاربری ساده طراحی شدهاند و بهراحتی از طریق اپلیکیشن موبایل یا پنل لمسی قابل استفاده هستند. تیم پشتیبانی ما نیز همیشه همراه شماست.
هزینه نهایی بستگی به نوع ساختمان، تعداد تجهیزات و سطح امکانات مورد نظر دارد. ما طرحهای متنوع و قابل انعطافی داریم که متناسب با بودجههای مختلف طراحی شدهاند.
بله، با استفاده از اپلیکیشن موبایل، میتوانید در هر زمان و از هر مکانی تجهیزات هوشمند ساختمان خود را کنترل و نظارت کنید؛ فقط کافیست به اینترنت متصل باشید.
ما از پروتکلهای رمزنگاریشده و سرورهای ایمن برای محافظت از اطلاعات کاربران استفاده میکنیم تا امنیت اطلاعات و تجهیزات شما کاملاً تضمین شود.
در هنگام قطعی برق، سیستم بهطور موقت غیرفعال میشود، اما پس از بازگشت برق، تنظیمات و اطلاعات حفظ شده و به صورت خودکار بازیابی میشوند. برخی از تجهیزات نیز با باتری پشتیبان کار میکنند. در صورت قطعی اینترنت، کنترل محلی از طریق پنل یا کلیدهای هوشمند همچنان ممکن است.
بله، سیستمهای ما ماژولار هستند، یعنی میتوانند به صورت مرحلهای اجرا شوند. مثلاً ابتدا فقط روشنایی و سپس تهویه، پردهها یا سیستم امنیتی را هوشمند کرد.
تمام محصولات ما دارای گارانتی معتبر و خدمات پس از فروش از طریق تیم پشتیبانی فنی هستند. همچنین آموزش کامل استفاده از سیستم نیز به مشتری ارائه میشود.
مقالات
هوشمندسازی ساختمان؛ گامی هوشمندانه بهسوی آینده
در دنیای امروز، هوشمندسازی ساختمان به یکی از مهمترین روندهای تحول در حوزه ...
بیشتر
افزایش امنیت منازل با استفاده از سیستمهای هوشمند
در دنیای امروز که دغدغههای امنیتی بیش از گذشته شدهاند، استفاده از ابزارهای هوشمند برای افزایش امنیت منازل به یکی از راهکارهای مؤثر و محبوب تبدیل شده است. سیستمهای خانه هوشمند به کاربران این امکان را میدهند تا بدون حضور فیزیکی ...
بیشتر